profiling采集
1.进程级别采集
url: https://www.hiascend.com/document/detail/zh/canncommercial/800/devaids/devtools/profiling/atlasprofiling_16_0001.html
title: "简介-性能调优工具-训练&推理开发-CANN商用版8.0.0开发文档-昇腾社区"
description: "<!DOCTYPE html> 简介 进行性能调优时,可以使用性能调优工具来采集和分析运行在昇腾AI处理器上的AI任务各个运行阶段的关键性能指标,用户可根据输出的性能数据,快速定位软、硬件性能瓶颈,提升AI任务性能分析的效率。 为方便用户使用,本文提供了多种性能数据采集方式,如图1所示,下面从便捷性角度给出选取建议: 图1 性能分析总体流程 表1 采集方式的选择采集方式 说明 msprof命令行工"
host: www.hiascend.com
favicon: https://www.hiascend.com/_static3/favicon.ico
image: https://www.hiascend.com/_static3/logo.BmJjMz5z.png
url: https://www.hiascend.com/document/detail/zh/CANNCommunityEdition/80RC2alpha001/devaids/auxiliarydevtool/atlasprofiling_16_0016.html
title: "动态采集性能数据-性能数据采集-msprof命令行工具-性能分析工具-开发工具-CANN社区版8.0.RC2.alpha001开发文档-昇腾社区"
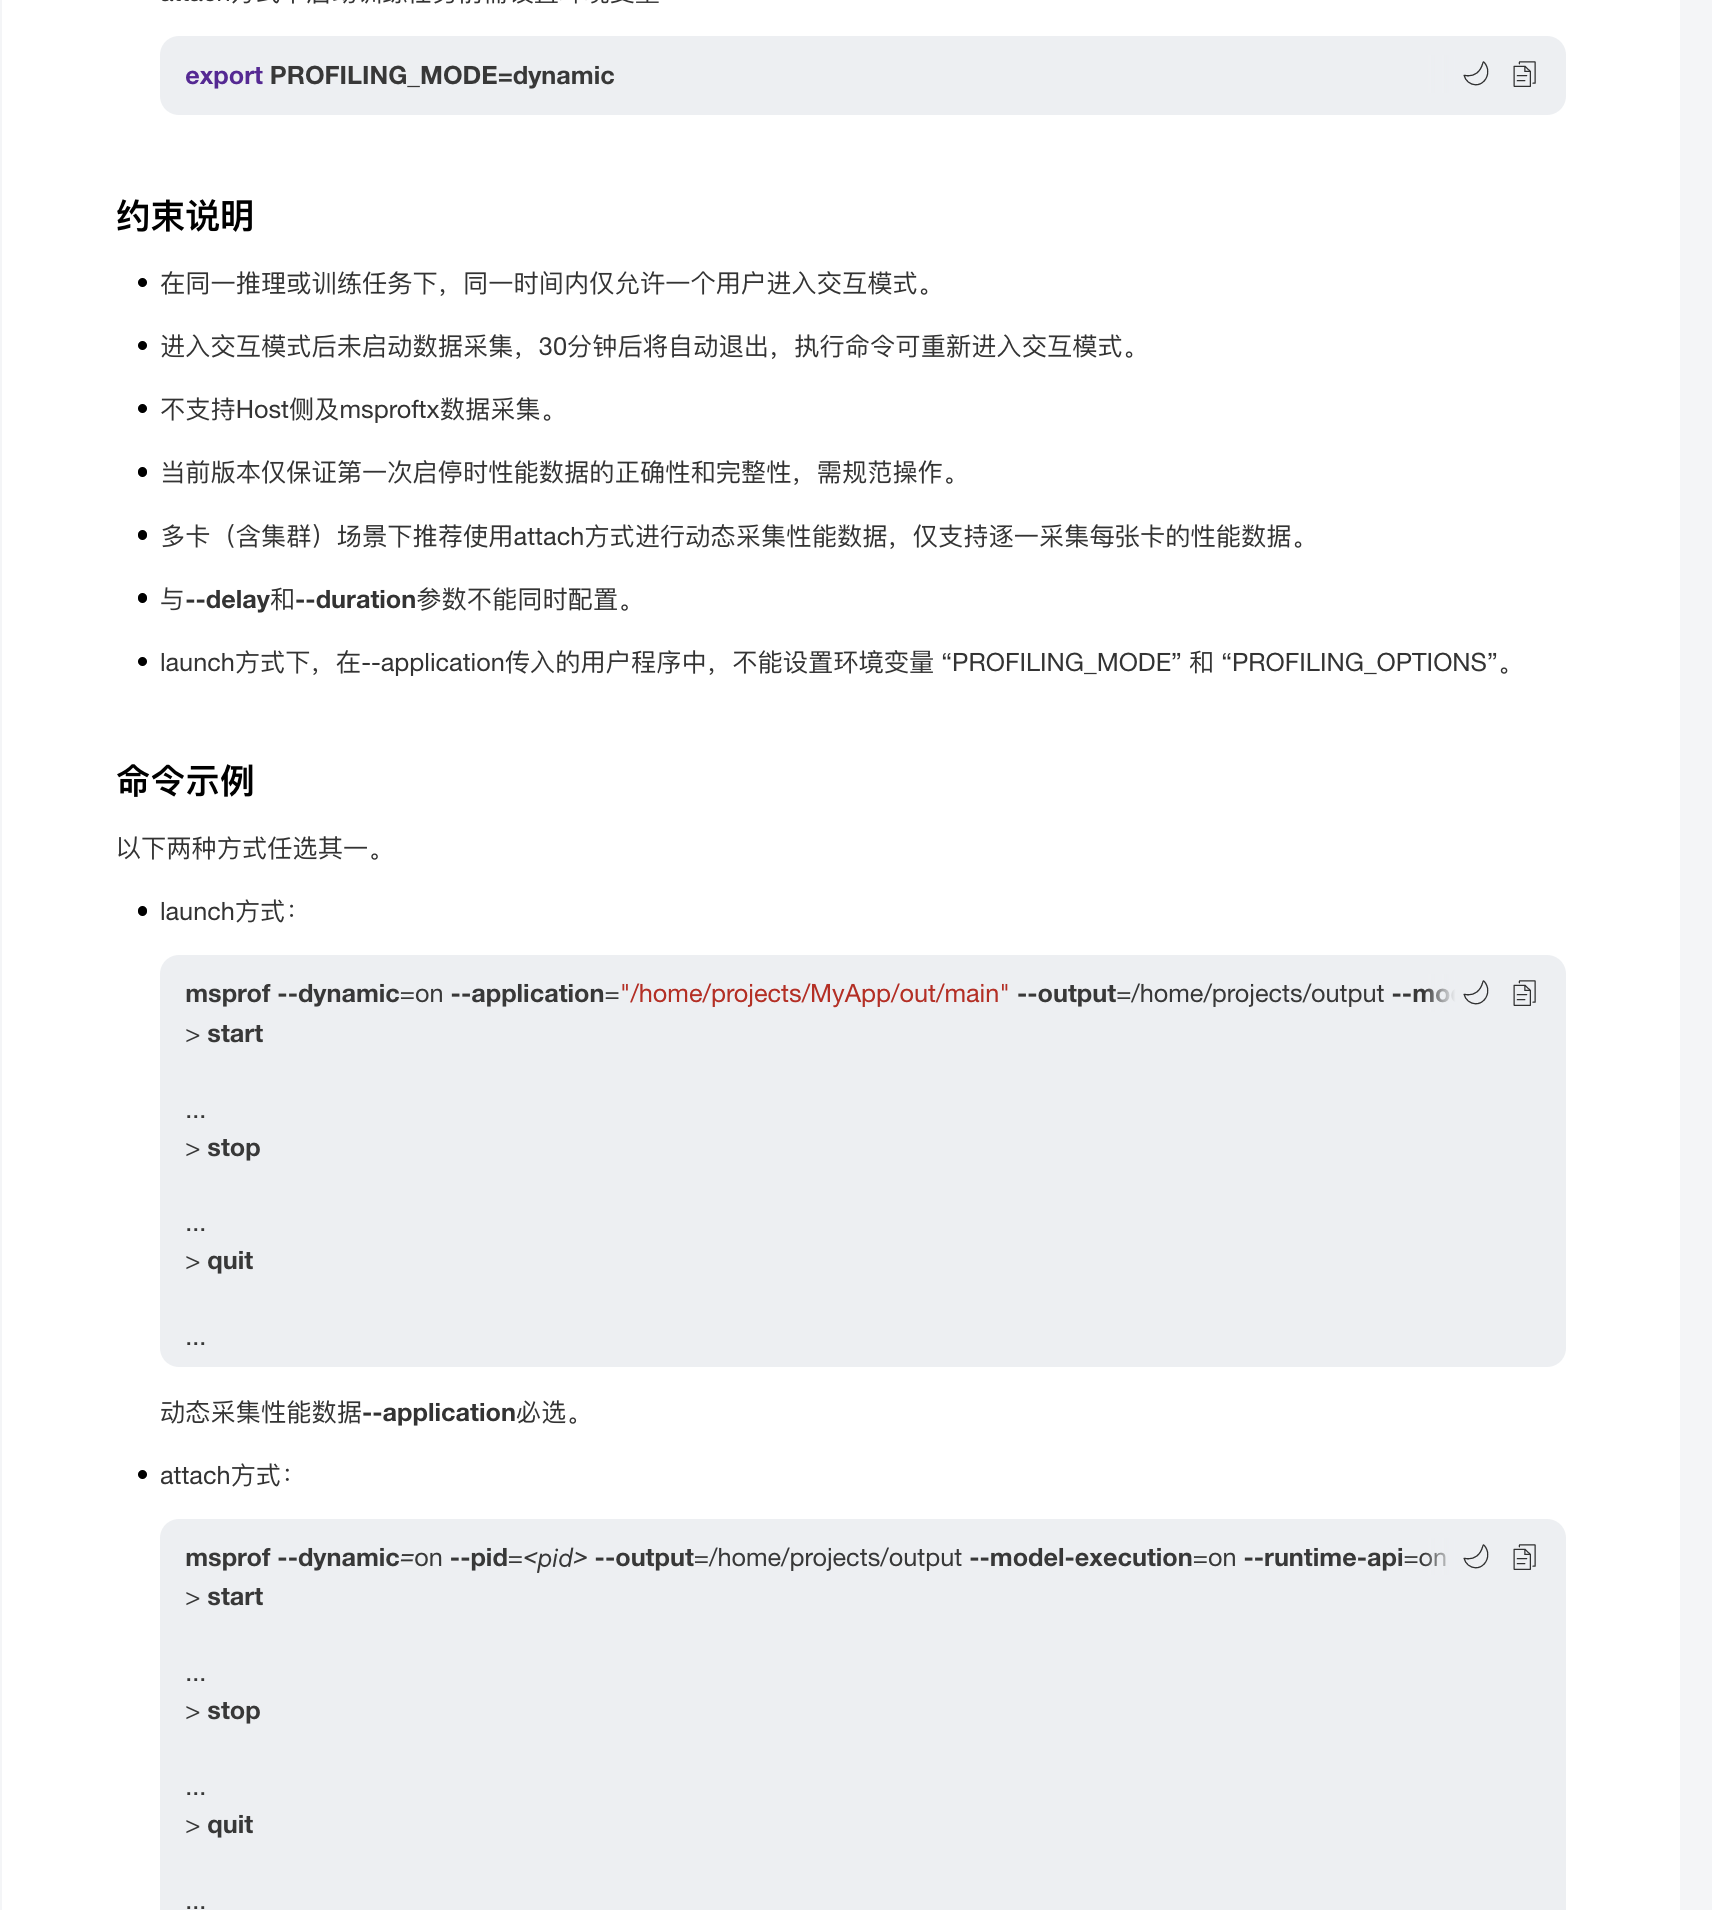
description: "<!DOCTYPE html> 动态采集性能数据 使用说明动态采集性能数据的主要功能是在执行性能数据采集的过程中可以随时启动和停止采集进程。 动态采集性能数据可以通过launch和attach两种方式执行: launch方式:msprof命令行启动动态采集时,同步调起推理或训练任务并进入性能数据采集交互模式,可以通过命令随时启动和停止采集。attach方式:用户先自行启动推理或训练任务,再启动ms"
host: www.hiascend.com
favicon: https://www.hiascend.com/_static3/favicon.ico
image: https://www.hiascend.com/_static3/logo.BmJjMz5z.png
比较原始的profiling采集方法,使用cann相关的工具包,对于训练和推理都可以进行相关的性能采集任务
注意
该采集方式是通过服务启动用户工作目录当前的sock文件进行通信的,比如是root用户启动推理任务的话,/root/目录会有一个sock文件,我们启动msprof采集任务的话也需要以root用户启动,如果推理任务的是HwHiAiUser启动的话,msprof也需要使用HwHiAiUser启动,防止msprof找不到对应的sock文件
2.常规采集
见高亮的20行和49行,如果只需要traceview.json的话只需要49行可以去除20行,加上20行的话torch npu会采集更详细的信息到指定文件夹,包含各个算子的耗时统计一系列csv文件
import torch
import torch_npu
import time

def test_linear(num_runs=200):
    forward_times = []
    backward_times = []

    input = torch.randn(
        [32768, 1, 1024], dtype=torch.bfloat16, device="npu", requires_grad=True
    )
    weight = torch.randn(
        [8192, 1024], dtype=torch.bfloat16, device="npu", requires_grad=True
    )

    llm_profile = torch_npu.profiler.profile(
                    activities=[torch_npu.profiler.ProfilerActivity.CPU, torch_npu.profiler.ProfilerActivity.NPU],
                    with_stack=True,
                    with_modules=True,
                    on_trace_ready=torch_npu.profiler.tensorboard_trace_handler("./910b_linear")
                )
    llm_profile.start()
    for _ in range(num_runs):
        # Measure forward time
        torch.npu.synchronize()
        fwd_start_time = time.time()
        # 模型层计算linear,使用torch npu总计有4种方式可实现该功能
        # 无论下面4种方式最终调用的是aclnnmm还是aclnnmatmul,最终在设备计算流上都是调用aclnnMm_MatMulCommon_MatMulV2,耗时也都相同
        # output_parallel = torch_npu.npu_linear(torch.squeeze(input), weight).unsqueeze(1)
        # output_parallel = torch.mm(torch.squeeze(input), weight.t()).unsqueeze(1)
        # output_parallel = torch.matmul(input, weight.t())
        output_parallel = torch.nn.functional.linear(input, weight)
        torch.npu.synchronize()
        fwd_end_time = time.time()
        forward_times.append(fwd_end_time - fwd_start_time)

        # Measure backward time
        if torch.is_tensor(output_parallel):
            label = torch.ones_like(output_parallel)
### torch.npu.synchronize()
            bwd_start_time = time.time()
            output_parallel.backward(label)
            torch.npu.synchronize()
            bwd_end_time = time.time()
            backward_times.append(bwd_end_time - bwd_start_time)
        else:
            raise RuntimeError("the result of forward is not a tensor")
    llm_profile.stop()
    llm_profile.export_chrome_trace(f"./910b_linear.json")
    avg_forward_time = (sum(forward_times) / num_runs) * 1000  # Convert to milliseconds
    avg_backward_time = (
        sum(backward_times) / num_runs
    ) * 1000  # Convert to milliseconds
    print("第一组测试")
    print(f"Average forward time over {num_runs} runs: {avg_forward_time:.3f} ms")
    print(f"Average backward time over {num_runs} runs: {avg_backward_time:.3f} ms")
    print(
        f"Average fwd+bwd time over {num_runs} runs: {avg_forward_time + avg_backward_time:.3f} ms"
    )

test_linear()